
JACKSONVILLE, Fla. — One of the more popular questions when dealing with any tropical storm is: "What are spaghetti plots?"
People poke fun at spaghetti models appearing as if someone took a handful of noodles and threw it on the map. However, there's much more to it!
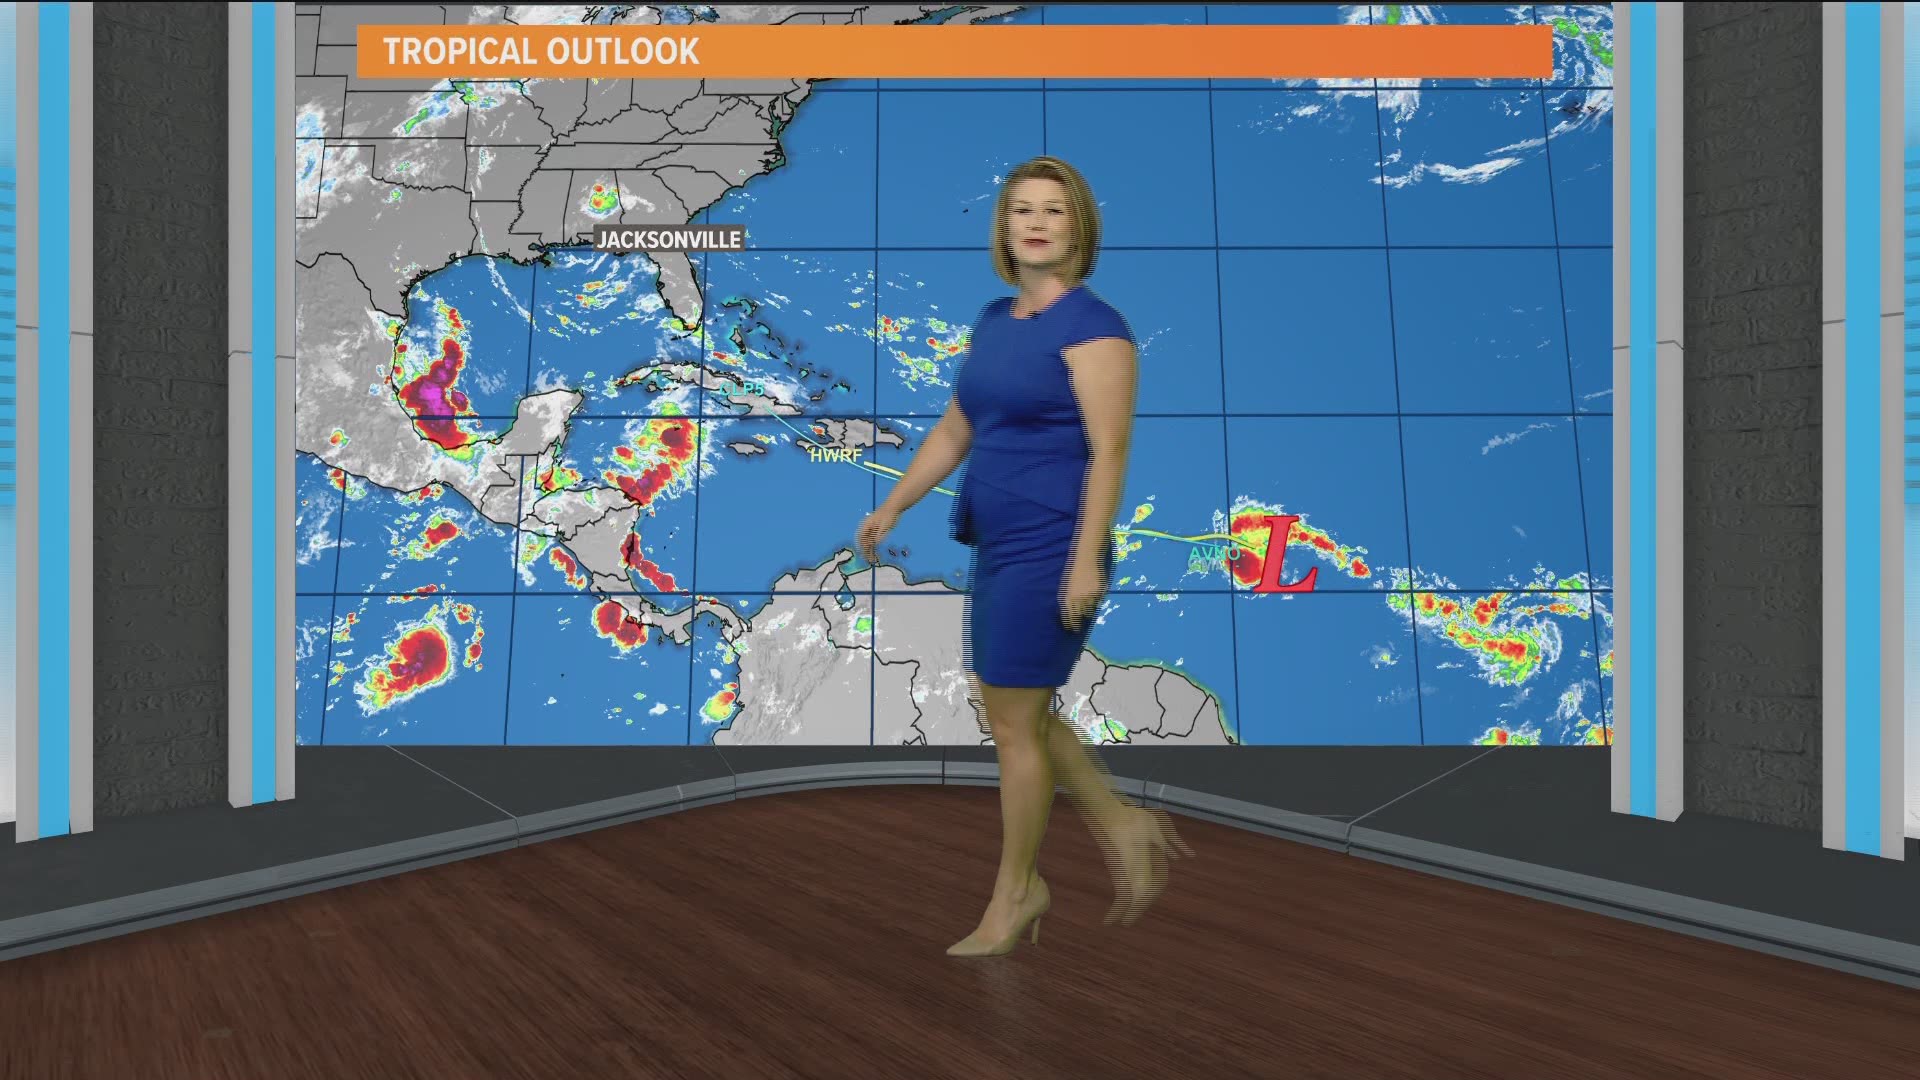
Spaghetti plots are a compilation of different computer models and different runs of those computer models showcased in lines on a map to show where a storm is headed.
They're used for exactly that purpose - to show WHERE a storm is headed and WHEN. They do not tell us the strength or intensity of a system, but simply the direction they will be moving and at what rate.
Spaghetti plots do not portray any impacts. These plots to not tell us how much rain a system will bring, what the wind speeds will be, how high of a surge to expect, or any other data. They only contain information on the center of a storm's future track.
When clustered together, the forecast confidence is high. When the lines diverge or are farther apart, the forecast confidence is lower.
Also, each model has a slightly different purpose and no single model can be used as a forecast.
In fact, no one particular model is perfect. It's almost like getting ten smart people in a room together and trying to solve a problem. Alone, one person may not be able to figure it out, but collectively the group can. That's why we take the consensus of spaghetti plots to get an idea of where tropical cyclones end up.
For example, the CLP5 uses past weather situations, or climatology, to diagnose what similar storms have done. The TVC is a track consensus model that estimates the forecast confidence. Models like the GFS, Euro, CMC, and HMON are dynamical and a little more complex.
Bottom line: Spaghetti plots are guidance, not a specific forecast!